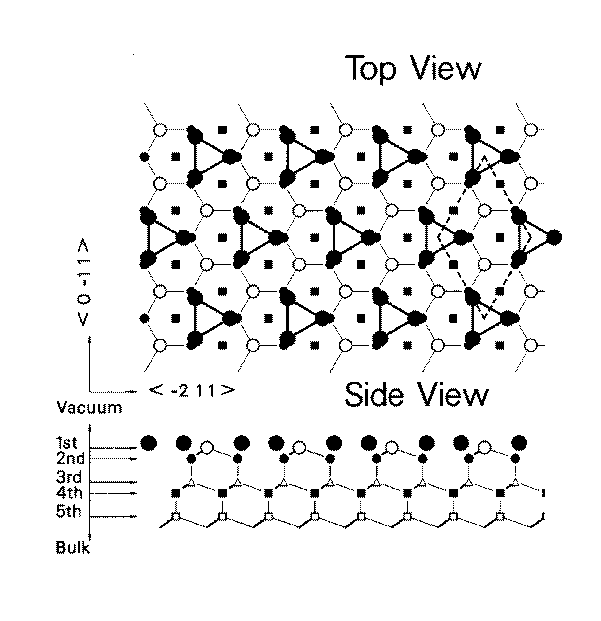
Figure 5.3:
The MCT-VT-T_1-T_4 model for Si{111}rt3*rt3-30-Au.
The large open circles are first-layer Si atoms forming a honeycomb (HC)
centered on first-layer vacancy sites.
The large closed circles are Au atoms on off-T_4 sites
forming trimers on T_1 sites.
 Back to the List of Figures
- Figure 5.1: The MCT-T_1-T_1-T_4 model for Si{111}rt3*rt3-30-Au.
- Figure 5.2: The MCT-T_1-T_1-H_3 model for Si{111}rt3*rt3-30-Au.
- Figure 5.3: The MCT-VT-T_1-T_4 model for Si{111}rt3*rt3-30-Au.
- Figure 5.4: The MCT-VT-T_1-H_3 model for Si{111}rt3*rt3-30-Au.
- Figure 5.5: The honeycomb (HC) model for Si{111}rt3*rt3-30-Au.
- Figure 5.6: Experimental AES data for Au/Si{111}.
- Figure 5.7: The MTL-T_4-H_3 model for Si{111}rt3*rt3-30-Au.
- Figure 5.8: The MTL-T_4-T_1 model for Si{111}rt3*rt3-30-Au.
- Figure 5.9: The relaxed MTL-T_1-H_3 model for Si{111}rt3*rt3-30-Au, also denoted conjugate honeycomb chained-trimer, as determined by a Keating energy analysis.
- Figure 5.10: The relaxed MTL-H_3-T_1 model for Si{111}rt3*rt3-30-Au, also denoted conjugate honeycomb chained-trimer, as determined by a Keating energy analysis.
- Figure 5.11: The relaxed MTL-T_1-H_3 model for Si{111}rt3*rt3-30-Ag, also denoted honeycomb chained-trimer, as determined by a Keating energy analysis.
- Figure 5.12: The relaxed MTL-H_3-T_1 model for Si{111}rt3*rt3-30-Ag, also denoted honeycomb chained-trimer, as determined by a Keating energy analysis.
- Figure 5.13,
5.14,
5.15,
5.16,
5.17, and
5.18: The LEED I(V) spectra of Si{111}rt3*rt3-30-Au.
- Figure 5.19: The experimental LEED spectra of Si{111}rt3*rt3-30-Au and Si{111}6*6-Au.
- Figure 5.20,5.21: The experimental LEED I(V) spectra for the Si-rt3-Au and -Ag surfaces, and the calculated spectra for the Si-rt3-Ag HCT-model.